

BBand Stop binary option strategy
BBand Stop Strategy is a 5 minute binary option trade strategy which uses BBand Stop alert indicator in MT4 to define ideal position to enter the trade.
How to setup the chart
Timeframe: M5
Template: BBand Stop Strategy (Download here: eDisk or UlozTo.Net)
How does this strategy work
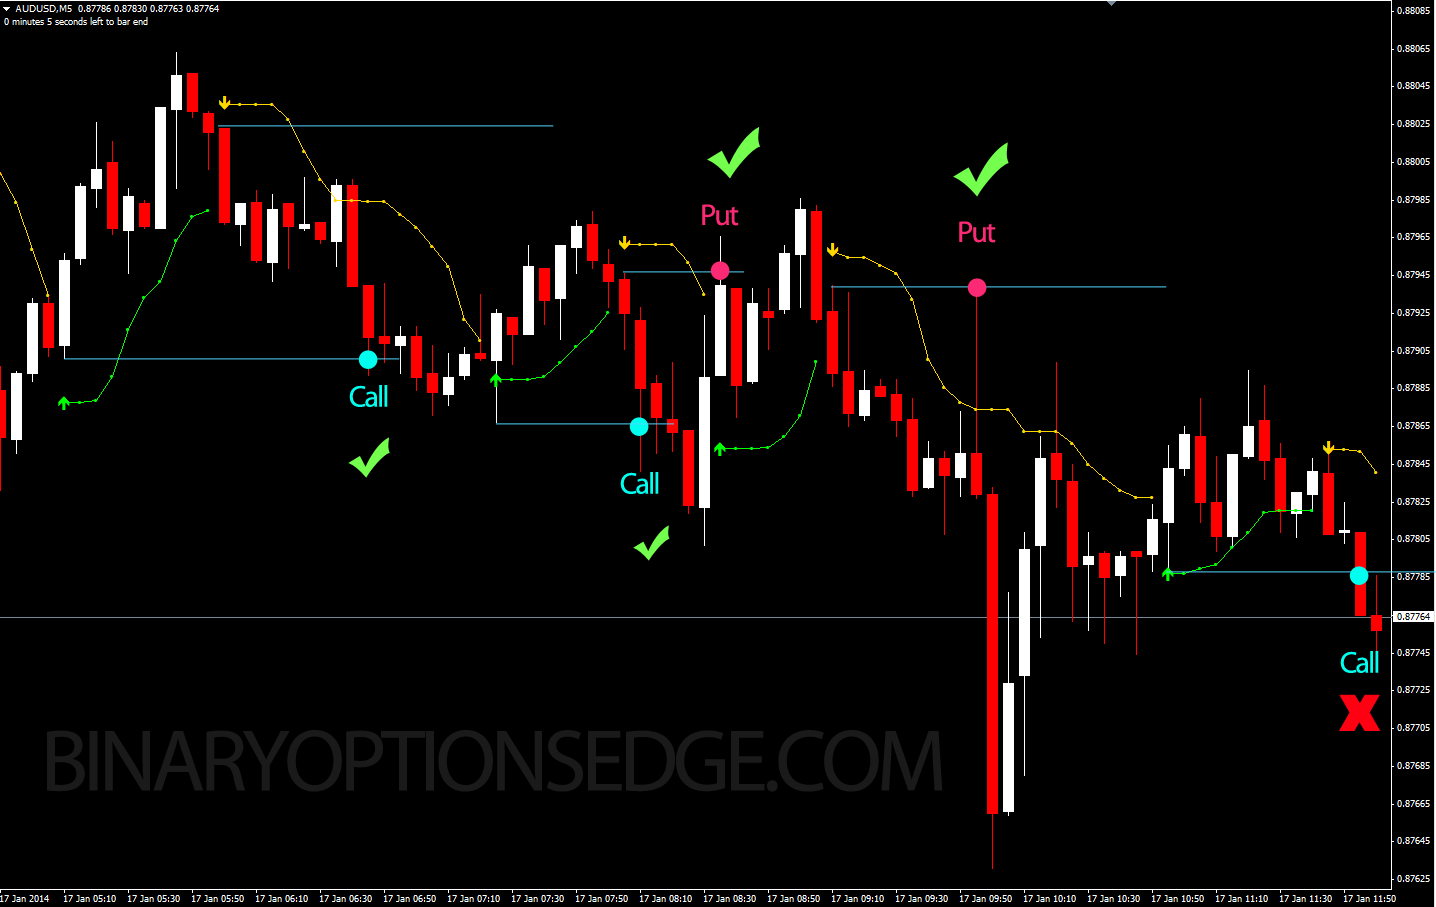
Arrows (pointing up and down) will be displayed over/under the candles after adding BBand Stop alert indicator to MT4. Draw straight line from the candle near arrow as soon as the arrow was displayed. Draw the line from downside if arrow points up (see picture). Draw the line from upside otherwise.
When to enter the trade
Buying a CALL option:
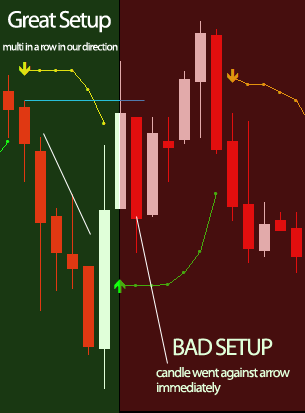
- If arrow pointing up appears and at least 3 candles share the same trend (1 small candle in opposite direction should not pose a risk).
Buying a PUT option:
- If arrow pointing down appears and at least 3 candles share the same trend (1 small candle in opposite direction should not pose a risk).
What does this strategy look like
Recommended broker for this strategy
| Broker |
 )
)
Must-read blogs
picture you drew a line from the first candle that displayed an arrow and then when it touches a candle later you say it’s a win (blue and red dots)?No
Wonderful clool
Chool
Wonderful
How I got my lost funds recovered in binary options investment, through the help of Andrew I have been in a deep shit all this while I almost lost all I have been investing from day one, I tried all I could to remain unbeatable I never gave up, sometime ago I was referred by a friend to one Mr Andrew for assistance with his master class intelligence and strategy I’m able to make $10,000 weekly and also recovered all my lost funds. I’m so happy.
If you need his help you can contact him through his Whataspp his number +263787350597.
bro so many queation are given by prople but no answer have ??? But why?? Answer all question please !!!
A good trading strategy should not be promoting any broker. Trader should not be saying things like it only works well with IQ option, or 24 option, or bd swiss. If it cannot work with all platforms it means its a louse strategy that does not work
Thank u all
pls can some one explain this strategy in full pls. I am confused.
I get it, you just need to read the directions better or over and over till you understand it. Simply put where the arrow occurs you need to draw a line from the highest point of that candle and drag it out. that would be your support or resistance line.
Hi. I just realised that the blue horizontal lines on the chart are the drawn lines. I thought they’d been put there to draw our attention to the indicator. However, I am still mystified as to what they do. What is the purpose of the lines. My other questions in the previous post remain. This looks like a good indicator….I just can’t get my head around it at all!!
I am also confused as to when you have entered the trades in this screenshot. Do you enter on the next candle after the arrow…waiting for the third candle in the trend? Should we wait until we see three trending candles close before considering an entry? Also, where are the lines that are drawn in and what is their purpose? Do they run vertically? Thank you.
Hello, I don’t understand something here. On the first picture you drew a line from the first candle that displayed an arrow and then when it touches a candle later you say it’s a win (blue and red dots)? How is that so? For how long must the trade be?