

Binary Options ‚3‘ Strategy That Works + Video
 While we go haywire finding a reliable trading system, we tend to miss out on the obvious. Three indicators strategy ensures high potential profits as it produces exact entry signals confirmed by 3 indicators. Moreover, it can be used with all sorts of currency pairs. This strategy that works is based on three most popular indicators; Relative Strength Index, Simple Moving Average and Full Stochastic Oscillator. You can think of trading binary options on much higher level when you’ve integrated these indicators.
Download the strategy, that works
Download indicators and templates: eDisk and Uloz.To
Watch the video below to see how the strategy works
However, there is no denial of the fact that every trader comes across a situation in which one indicator that is used by almost all the traders, sometimes show inaccurate signals. So, using additional indicators will help in filtering out the false signals. Read on to learn about the three different indicators that just work mentioned above.
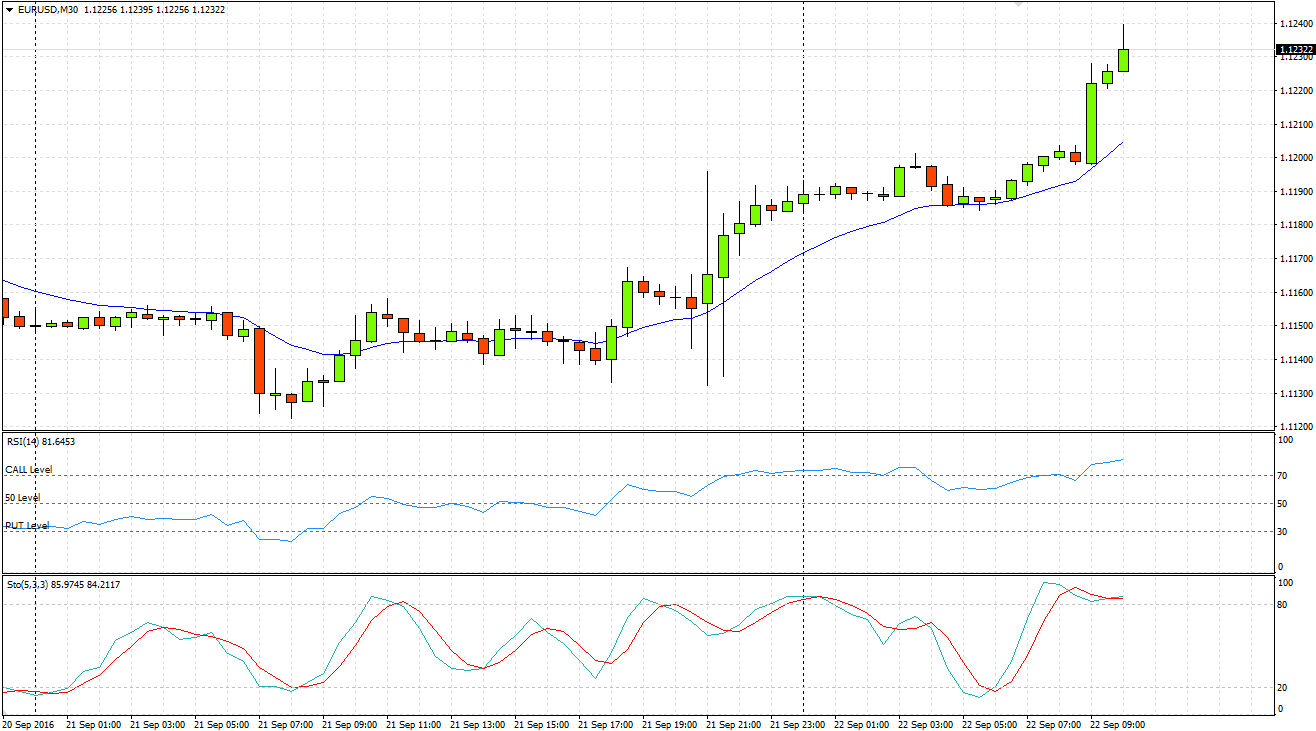
Relative Strength Index
The so called ‘RSI’ focuses on the price direction, unlike the ones that mostly look at the overbought or oversold price. In this binary options trading strategy the RSI level 50 decides whether the trend is bearish or bullish. If the RSI is more than 50, then a rise in the price is expected.
However, call option buying will occur if the RSI value is more than 50, but lesser than 70. On the contrary, buying put options is suggested if the RSI value falls somewhere between 30 and 50.
Stochastic Indicator Signals
Not only is it very well known for oscillation, but also for its technical analysis capabilities. The direction of the oscillator coincides with the price movement direction. You need to find stochastic between 20 and 80 as this will let you know about the present overbought or oversold asset.
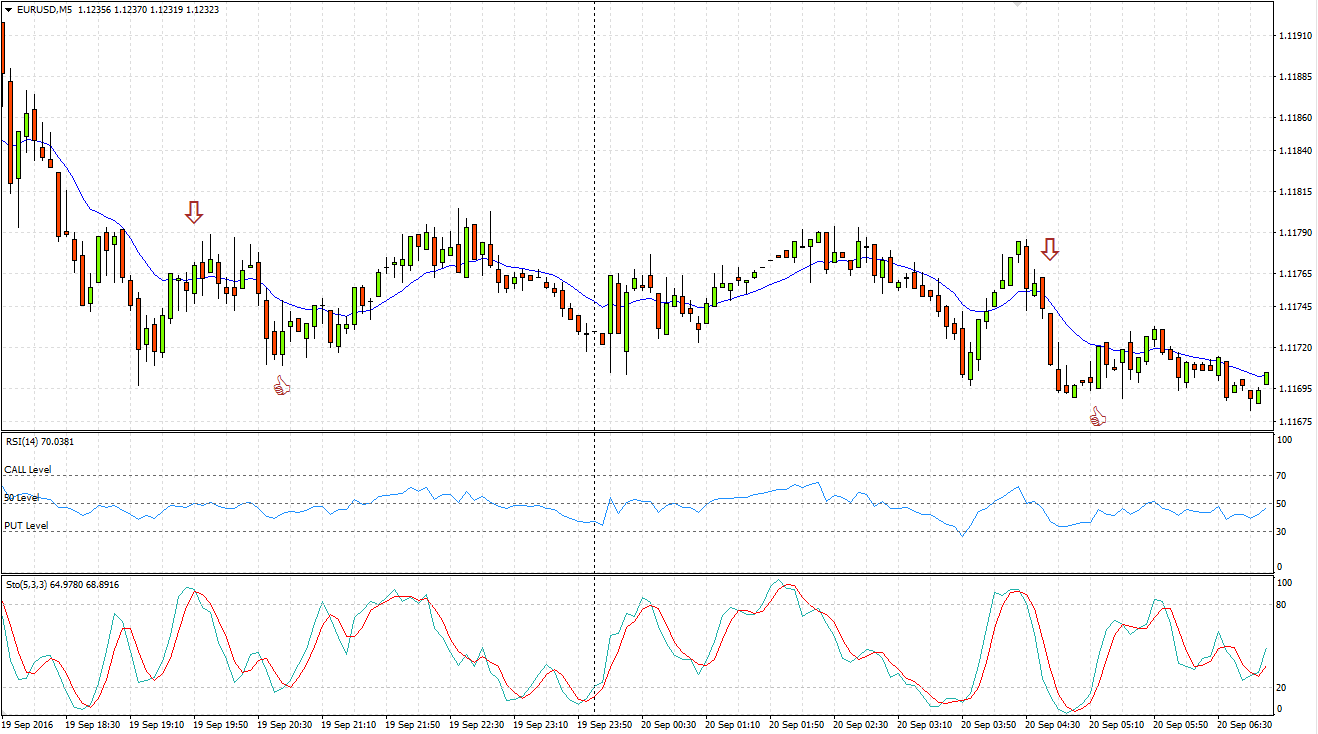
Personally I like to filter signals in two ways with this indicator:
- either: Stochastic crosses 80 (for put) or 20 (for call) line
- or: Stochastic is pointing upwards (for call) or downward (for put)
Moving Average
Different strategies developed at the intersection of Moving Average with so many different periods shows the right moment during which the market has taken an unambiguous direction, whereas the traders have decided to either purchase or sell an asset.
There’s a ton of strategies including Moving averages. For example:
- EMA Rainbow Strategy for binary options
- Binary Options Trading Reversals - EMA, MACD and RSI Strategy
Combining all these will result in a great strategy!
Video: Testing the strategy, that works
In the video below, you can see a few testing trades with this strategy. Let me know in the comments if you like it!

 (+10738 rating, 14 970 votes)
Recommended broker for this strategy
| Broker |
Is it non repaint arrow ?
back testing a strat, using indicators will often show good results, but they are all lagging, in real live trading they dont work.
1min chart and 2min expiry its work
what timeframe and what time of expiration i must to use ?
is it 5min chart and 10min expiration ?
1min chart and 2min expiration
Hi Guys,
Can I just confirm the setting on the moving average please. I also assume it is 5 min chart and 15 min expiry??
Cheers
Same question!
If what on the video, it look like M10 expired.
Cause if wait for the first candle closed we have to count for next 3 candles.
He’s doing it on 30m chart 🤔
Two words „It Works“
Thanks for your message ProfitUnist!! 🙂 🙂
Please add the MA and other indicators settings ASAP
Regards
Unfortunately, I dont have time for that.. 🙁
The strategy is ok ,but i dont understand it can i have 1-1 training on the strategy pls.
Unfortunately, we don’t have for that. Maybe somebody here will contact you
Which timeframe should be used for 5 minute expiries, 1M?
60 Seconds binary options strategy 99 – 100% Winning (100% profit guaranteed )
which 60 second strategy?
Hello,
I want to try this strategy as it looks very accurate. Will update with any results.
Thanks,
Hi Martin, so how is it going with the „working strategy“? 😉
I tested this strategy based on the following conditions:
Cross SMA(14) and candle close above / below the SMA
RSI(14) up / down
STOCH(5,3,3) up / down
with EUR/USD 5mins data (London session) in April 2017.
The accuracy is around 55%.
Thanks for this. Is there any way to use CCI and volume indicators with this? These have helped me to filter with other strategies
What moving average is used here, please?
Hey bro, it’s 14 period 😉
bro its ema/sma/wma?
Has anyone tried this strategy?
Yes its Nice but You need to be carefzl In low volatility markets
that means it’s good in high volatility markets?
Yeah should be