The GEEK Strategy of Moving Averages
Are you looking for a moving average strategy for binary options?
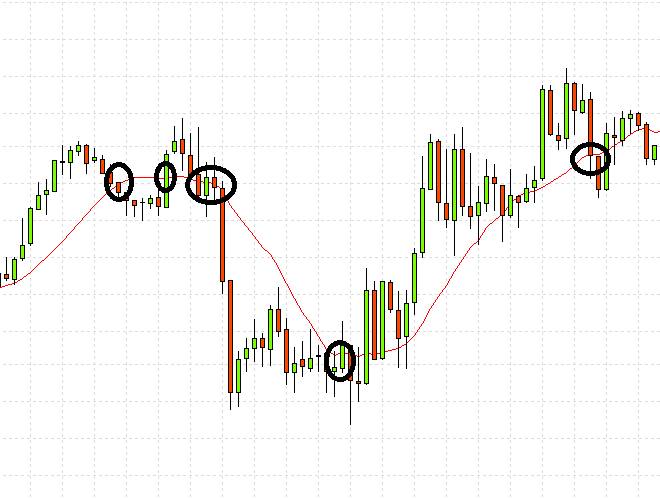
One of the easiest ways to trade the forex markets is by using a moving strategy. While this strategy may be simple, the moving average needs to be exponential. This ensures you accomplish the right trades sooner and you squeeze a little more out of the prices. You can improve this system by adding a moving average. In this way, you can measure extremes as well as get information from crossovers. Let’s look at a 30 bar exponential moving average to demonstrate and use 2 time frames, 30 minutes and daily. The moving average will be kept at 30 bars for both time frames.
We also have a similar strategy using MA, called the Rainbow Strategy:
EMA Rainbow Strategy for binary options
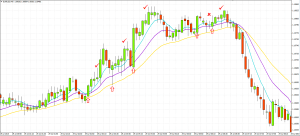
 Blue moving average is on top and golden is on the bottom.This strategy uses only one indicator and that is good old Moving Average which you may have already used and know about it. We will use three EMA (Exponential Moving Average) set to 6, 14 and 26 colored differently to determine the trend and […]
Why use a moving average?
Measuring average prices over a period of time is a excellent way to gauge market strength and the current trend. Moving averages allows you to do this and can also be used to create the basis for a technical analysis. Moving averages are also referred to as a rolling mean. When the moving average is plotted alongside current pricing, the data produced measures trend. When prices hit higher levels, the moving average escalates as well and decreases when prices close lower. To ensure the exponential moving average offers value as a current indicator, the older data has less weight than the newer information gained.

So how does it work?
Working on 2 separate time frames and an exponential moving average of 30 days you can begin to pick up trends. The longer time frame will show an underlying trend which can be used as a foundation. When you work on the daily time frame, you can see when the trend is bullish (above the moving average) or bearish (below the moving average). It is important to note, that while this is an indicator, other factors should be taken in to consideration such as the resistance, support and the long term trend. If the price has been above the moving average for quite some time and is nearing it’s long term resistance, be more cautious than if it has just moved above the resistance and is appearing to be on an upward trend.
Once you are sure of the underlying trend and you have ascertained that it is not about to reach a turning point, you can start working on a 30 minute bar chart. After around 10 days you would have a good view of support/resistance and the trend.

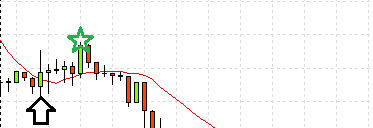
It can take quite a few hours to receive confirmation. Check the daily charts before continuing. Limit expiration from 1-4 hours. Signals may not also develop on a daily basis, but you may receive more than one in a single day. Your expiration will be shorter the closer the turning point seems to be. When the market is bullish, once the asset reaches above the 30 bar exponential moving average, this will be the signal to buy. You may miss the first signal and possibly take a loss on the final signal, but the signals in between should make up for it and help you achieve success.
This system works, it is a simple technical analysis which most traders in the current market place and often forms the basis for upper level, more complicate techniques. For amateur traders, this strategy is a good place to start. You need to learn the basics of technical analysis to understand the markets and a moving average system will help you with this skill. You should be able to achieve results on a consistent basis when you apply this strategy properly.
Recommended broker for this strategy
| Broker |


 )
)