Trading With Hikkake Pattern Indicator MQL4
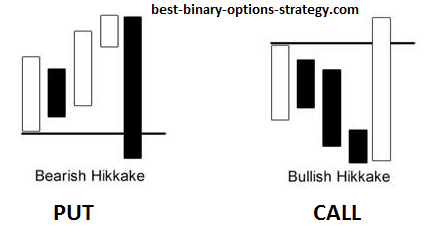
Hikkake in binary trading is a charting pattern that traders use mainly to identify the direction in which the market is moving. Actually, ‘Hikkake’ is a Japanese word which means trick. This trading strategy is simple and by involving only three price bars, it can predict rightly about the condition of market in the near future.
Alone, this Hikkake strategy may not bring huge profit to the traders. But, when you combine some existing strategies and indicators with it, the results can be amazing.
Using Hikkake Pattern in Binary Trading
The Hikkake strategy consists of 2 to 3 figure charts or bar charts. To identify the pattern, the traders need to find inside bars. These kinds of bars are drawn inside the pattern. More info about candle patterns: Trading Candlestick Formations. Two bars are formed in this inside pattern - one that is already there, and the other is inside the high and low charting of the first bar.

To call a pattern Hikkake, the second bar should open and close itself within the highs and lows of the previous bar. However, due to such a formation, the entire shape may appear immaterial.

Most of the times, traders mistakenly assume bullish or bearish harami patterns as inside bars. They fail to find out the difference mainly because Hikkake goes well with both types of harami patterns. It’s very important to confirm every hikkkae breakout prior to trading.
Simply said, any inside bar that couldn’t form properly or completely can be taken as Hikkake formation. Pretty similar to the formation of candlesticks, the inside bars are formed with the closing of the candlestick inside the periphery of the existing candle. You can start trading as soon as you observe a breakout in close or open of the existing candlestick.
Steps to Trade with Hikkake Pattern Successfully
- Step 1# Finding out the inside bar pattern: To identify this, begin with searching big-sized candles, followed by smaller candles within their close or open structure.
- Step 2# Breakout Point: Look carefully at the formation to find out where the breakout is.
- Step 3# Start Trading: Once you locate the breakout, join trading. When the breakout occurs, the direction of moving of the price changes.
- Step 4# Choose Stop Loss: Opt for stop loss when in the range, the price touches the highest point of the last three candles. Or, when the price reaches the lowest point of the last three candles, go for stop loss. By doing so, you will be able to take stop loss close to resistance or support.
Now, comes the question - How will you ensure whether a pattern is Hikkake or not? To answer this question, you need to ignore the first two bars formed inside the pattern. Rather, try to identify the third one. A Hikkake pattern is said to be bullish when the second bar inside the pattern has a lower low and a higher high than the inside bar’s high and low. In such a situation, the third candlestick should close itself at a point higher than the high of the inside bar pattern.
Hikkake Pattern Indicator
A pattern is said to be bearish when the high and low of the second bar doesn’t exceed the limits of high and low of the inside bar. However, you can easily indentify a hikkake pattern with some indicators.
Download Hikkake Pattern Indicator:
Hikkake Trading (Video)
You can watch the video below, where a certain trader shows how to trade with this kind of pattern.
Bottom Line
A Hikkake pattern may be known among the traders for its versatility, but that doesn’t mean that it comes with a guarantee of huge return. It is only one of its characteristics, and nothing else. To frame an effective trading strategy, make sure that you have mixed it with other powerful and put-to-test strategies. As for instance, if you combine Bollinger Band with the Hikkake signals, your trading accuracy will increase automatically. It’s better to do enough research on the topic so that you can use it with confidence.

 (+650 rating, 930 votes)
Recommended broker for this strategy
| Broker |

