

Trading with Flag and Pennant Chart Patterns
The Flag and Pennant are short-term trend continuation patterns that represent temporary pauses in an active market. Immediately after a fast, big move, they appear in the chart. When the trend is strong, they send reliable signals of trend continuation. But, they start to represent pauses with the consolidation of the trend. Do you want to know how it can bring success to your binary trading? If interested, check it out.
Before the formation of patterns, the price experiences either a sharp rise or sharp decline in a high trade volume. This plays an important role mainly in determining the accuracy of the formation.
Flags and Pennants are short-term continuation patterns that mark a small consolidation before the previous move resumes. These patterns are usually preceded by a sharp advance or decline with heavy volume, and mark a mid-point of the move.
Source: Stockcharts
A Flag in Binary Trading
In a correction, when a trader can draw parallel lines through the peaks and the troughs, a flag is said to be formed. It resembles a rectangle having sloping lines of trend. Most of the times, the direction of the sloping trend line is opposite to that of sharp initial movement of the price. As these kinds of patterns occur quite frequently, any trader would find it difficult to notice the market fluctuations using it.
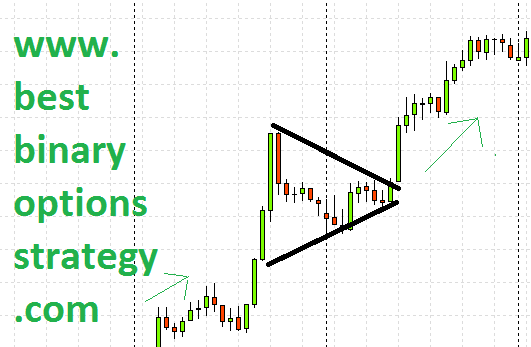
A Pennant in Binary Trading
A Pennant pattern looks similar to a symmetrical triangle. Here, the trend lines of resistance and support come together. Unlike the flag patterns, direction doesn’t have any important role to play in pennant ones. Generally, it has a flat structure.
How Can You Characterize a Flag and Pennant Pattern?
Though both Flag and Pennant form without a stop, yet there are certain features that will help you to distinguish between the two. Let’s see what they are:
- Acute Rise or Decline: Identify where exactly the price has either suffered a sharp decline or experienced an acute rise of the trade volume. You should know that it, being a continuation pattern, there should be an existing trend, prior to the occurrence of the formation. Huge rise or decline in the market is signalled by the sharp decline or rise. Therefore, you can consider flag and pennant formation as an adjournment just before the revival of the trend.
- Lasting Period: Both flag and pennants are short-term and temporary formations. However, they can last for twelve weeks maximum. Most of the times, these kinds of formations are seen in the charts for 1 to 4 weeks. Traders start to take flag as a rectangle when a flag is noticed in the chart even after the passing of 12 weeks. And when a pennant lasts for more than 3 months, its original symmetrical shape changes itself into an asymmetrical shape. To say precisely, if these kinds of patterns remain for more than 8 weeks, fail to send important signals.
- A Flagpole Formation: The flagpole formation is crucial to measure the gap between flag or pennant’s initial resistance or support and their high or low point. It is formed when between the breaks of sharp rise or decline of flag or pennant and in their high or low points, a trend line is formed.
- Levels of Volume: The trade volume is expected to be high when there is acute rise or decline during the flagpole formation. Actually, it is the high volume that validates the formations of flag and pennant patterns. Moreover, the level of the volume is essential in knowing how long the prevailing trend will last.
Trading strategy using these patterns
These patterns enable the traders to trade safely. As the patterns formations take place continuously, very rarely they fail in generating right signals. It’s because of this reason, the novice traders find it useful.
Recommended broker for this strategy
| Broker |
 )
)