MARSI Strategy - Gaps and other trade signals
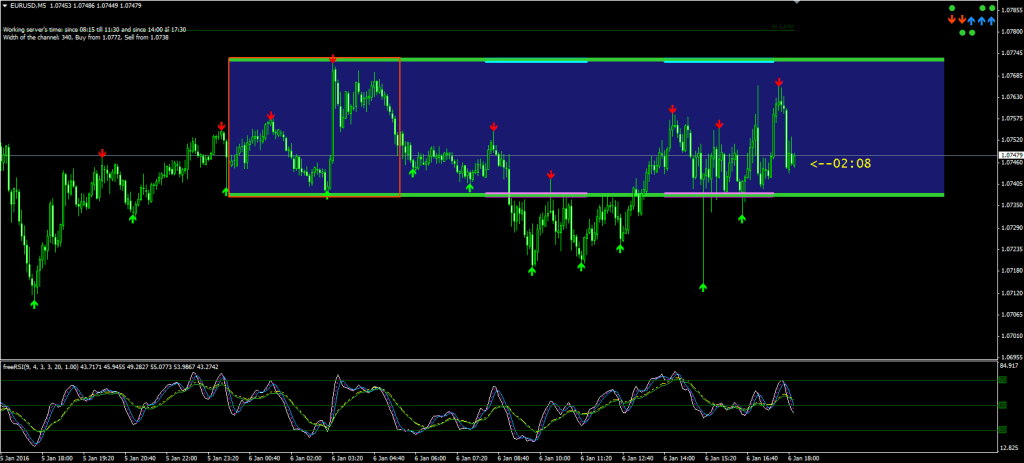
MARSI is a strategy that uses the lines of support and resistance. These are drawn automatically and we only need to pay attention when an arrow appears.
How to setup the chart
Timeframe: M5
Template: MARSI Strategy (Download this binary options strategy here; or download it here)
How does this strategy work
As soon as an arrow appears, we need to confirm that this is a real signal (The RSI indicator line is above or below 50, depending on the type of signal) – afterwards, open a trade for 3 times the timeframe. If you are using M5 timeframe, open a 15 minute trade. If you’re using M1 timeframe, the expiration time will be 3 or 5 minutes.
When to enter a trade
Entering a CALL trade:
- Current candle is rising (black)
- Green arrow is under previous candle
- RSI indicator on current candle is below 50
Enterint a PUT trade:
- Current candle is falling (white)
- Red arrow is above previous candle
- RSI indicator on current candle is above 50
Binary options MARSI strategy screenshots
Our results with this strategy
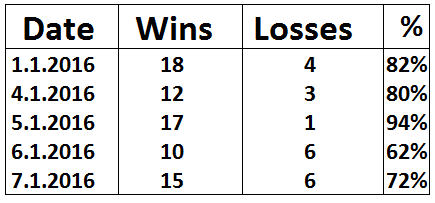
We have tested this strategy for a couple of days and the success rate was 78 %, which is not bad at all. If you want, I recommend this strategy to you. You can have a look at more detailed statistics underneath.

 (-72 rating, 3 310 votes)
Recommended broker for this strategy
| Broker |


Must-read blogs
How did you get those %? It keeps repainting.
What sessions is this best to trade?
Any tips for how to get this working well?
Thank you
Hi, Im not we just copied this strategy from somewhere else. 🙁
8 am…12pm-5pm
watch market news
learn patterns of candlestick formations near zones of support and resistance, use raising scale to recover any loses, do not trade more than 3 loses in a row even its rare. You don’t need anything else for being profitable
Hi
what’s means Current candle is rising (black) or Current candle is falling (white), because to know it’s high candle or low I must wait to close or that means if the entry price is lower the top of the candle or higher than the lowest price of the candle?
does anyone has good results with this strategy?
Regards
Hi Miro, it’s simple, just see whether the candle is bullish (upwards) or bearish (downwards)
is that 1 min chart 3 minutes expiration results or 5 minutes chart with 15 minutes expiration results?
Hi, it’s M5 and 15 min exp
Areitlcs like this just make me want to visit your website even more.